51. Statistieken van iNaturalist in 2020
https://www.inaturalist.org/stats/2020 bevat informatie over "Studies That Used iNaturalist Data in 2020" en mensen die websites en de apps in 77 verschilende talen vertaald hebben. We zien dat Nederland op de 25ste plek staat en Belgie op de 27 ste plek met 104.000 waarnemingen. 29ste is Switzerland en op de 26ste plaats staat Costa Rica. In 2019 stond Nederland op de 26ste plaats en Belgie op de 28ste, dus er is niet veel sprake van toename..waarschijnlijk omdat 2019 een bovenwaarschijnlijk goed jaar was.
Corona
Toch apart dat in de USA nu rond de 326.000 Corona doden gevallen zijn terwijl tijden de hele tweede wereld oorlog maar 291,557 militiarne sneuvelden. Je zou misschien denken dat dit grote gevolgen heeft en dat heeft het voor een deel ook. De nationale parken in America waren dicht, dus daar zijn de waarnemingen flink gedaald. Ook was het jaarlijkse biodiversiteitsfeest afgelast. Voor het iNaturalist Team was did wel een grote aanslag omdat Carrie en Loarie, die beide kinderen hebben, veel thuis waren en ook niet naar school gegaan zijn.
Performance Problems
Zoals het jaaroverzicht (https://www.inaturalist.org/stats/2019) laat zien groeit iNaturalist wereld wijd en met name in Rusland, Canada, UK en Mexico. Deze performance heeft continu de aandacht van het iNaturalist Team en afgelopen jaar zijn er al aanpassingen gedaan aan de 'Maps" de plattegronden. Zoals je nu ziet zie je eeerst allerlei rode vierkantjes verschijnen en pas bij een hoog zoom level zie je de daadwerkelijke waarnemingen. Het bleek namelijk dat 24% van alle CPU en power van iNaturalist naar het maken van deze high level kaarten ging terwijl ze over een dag of week eigenlijk niet zoveel veranderen.
De muskus rat Gerald was geen probleem voor de performance..maar een "Place" toevoegen kan veel problemen geven, zeker als het een grote plaats betreft.
Jaar Overzicht, Year in Review 2020
e dig into the data for our Year in Review blog post: https://www.inaturalist.org/blog/44876-year-in-review-2020
https://www.inaturalist.org/blog/44876-year-in-review-2020
https://www.facebook.com/inaturalist/
https://www.inaturalist.org/stats/2020 b
It's the end of the year and here at iNat that means another Year in Review (don't forget, you can make your own, too). Of course, 2020 wasn't a typical year, so this go around I figured I'd spend a little time trying to answer the question many people asked us this year: how is COVID-19 affecting iNaturalist?
When lockdowns and stay-at-home orders started going into effect around the world in March, there was a lot of speculation about what would happen on iNat. Would we see less activity because people couldn't travel as far or as much as they used to? Would we see more because people were spending even more of their lives on the Internet? There was even an early and largely falsified series of social media posts out there about nature "returning" to the world now that humans had supposedly abandoned it, so some journalists were wondering if we were seeing that in iNat data.
That last question is the easiest to answer: no, we didn't, not because the behavior of all the other organisms changed (or not), but because for most of them we simply don't have the amount or regularity of data to detect changes like that. Even if we did, that data is entirely dependent on people, particularly people behaving consistently in the aggregate, and 2020 was just not the year to assume that people were behaving the same as they were last year.
So let's try a question that we might have a shot at: did people use iNat more or less when the pandemic set in? Answer: they used it more... but maybe not more than they would have without a pandemic:
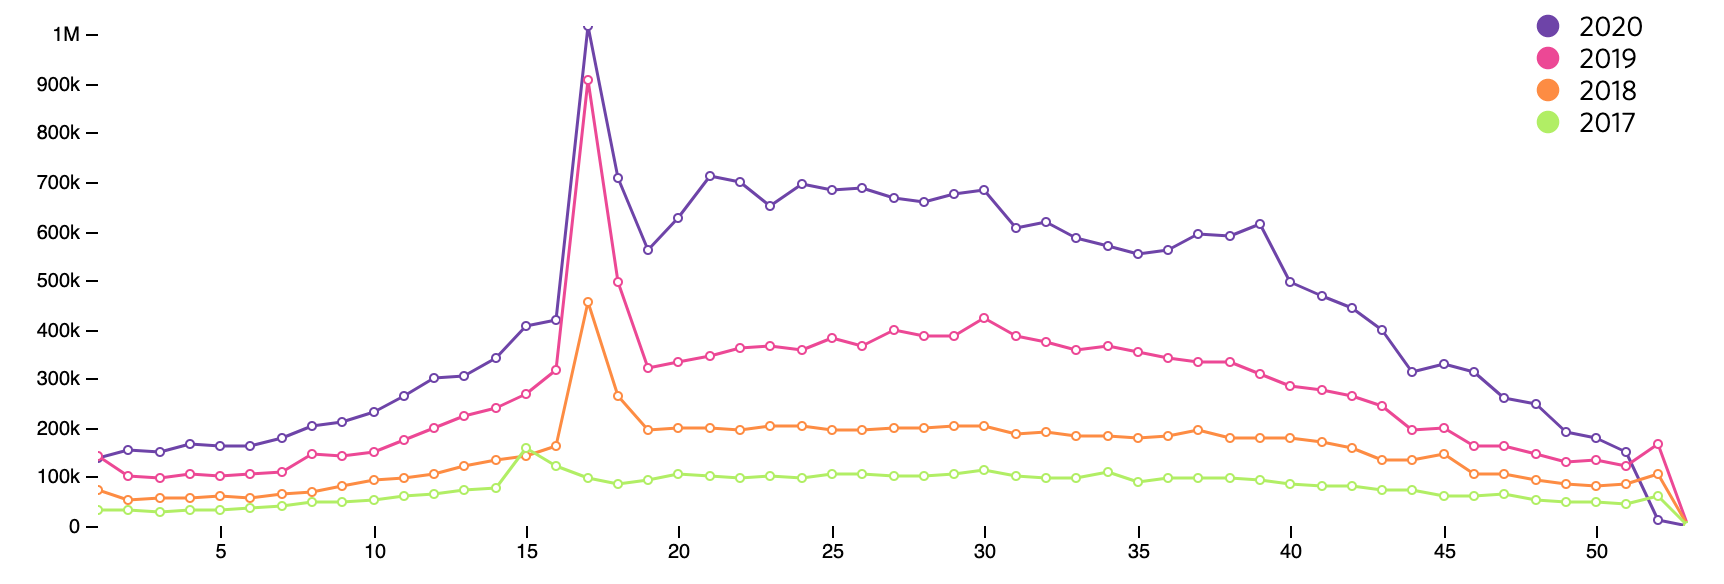
That's verifiable observations by week of the year observed from the last four years (week of year is a bit weird but it makes it easy to compare years with a little more resolution than months). You can see people observed more than ever before in 2020, but maybe not quite as much more than the difference between 2018 and 2019. Plus you can see that City Nature Challenge (the big spike in Spring) took a serious hit, only barely exceeding its 2019 numbers (City Nature Challenge isn't organized by iNat, but it's regularly the biggest single event on iNat).
The number of people making those observations shows a similar pattern:

Early in the pandemic we were observing minor shifts in intra-week activity, i.e. people seemed to be making more observations during weekdays than on weekends than they did in 2019, but that pattern seemed to go away after a few weeks.

One of my favorite metrics of COVID's impact on iNat behavior is unfortunately also one of the hardest to explain, but in short: people traveled less to make observations in 2020. Surprise! The way we looked at this was to draw a rectangle around all the obs each person made each month and measure that rectangle's diagonal as an estimate of how far they traveled, and then calculated some stats on those numbers. Here's what that looks like for each month in 2019 and 2020:

It's definitely a bit zany, but you can see steep upticks around the solstices in 2019, which I would expect for summer/winter holiday travel, and then a big dip when COVID sets in and people stopped traveling. Those of you who remember your geometry and think about my description of this metric will realize that it's only a rough estimate, but it's a lot quicker to compute than measuring the actual maximum distance between observations.
Newly-added species also took a hit, as you can see in the YIR chart.
We also wondered if more of the observations added this year were actually observed in prior years, so we calculated these percentages for each year of iNat's life ("backlog" observations):

So... we're not seeing any major shift in backlogging, and in fact it seems to be stabilizing over time.
Finally it's important to remember that many of the benefits of iNat specifically and natural history more generally are impossible to measure and chart. Taking the time to slow down, consider another creature, and deliberately document the encounter has always been, for many of us, a source of solace in itself. It's an act that's just as grounding when you do it in a neighborhood park as when you do it in far-flung locales, a fact that has been crucial this year as we've all been spending more time at home. I know I personally cut way down on nature-related travel this year, but I think I also appreciated my local hikes even more. I distinctly remember the surprising sense of... unknotting I felt on the first long hike I went on with my partner during the pandemic. Just to be reminded that the sun was still shining and the plants were still growing seemed strangely revelatory, easing a tension I wasn't fully aware of.


Comentarios
Agregar un comentario